


While many in the community shared concerns about rising rents and potential displacement, current data presents a more complicated picture.
Housing Rentals
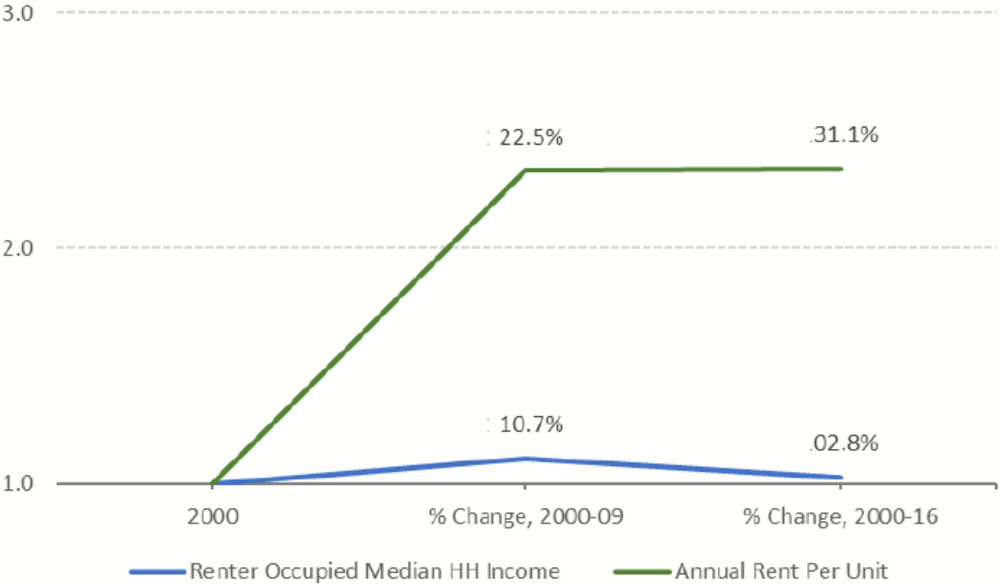
Overall, asking rents for multifamily properties in the study area over the last 16 years have increased, see Table 8.1. Average nominal rents in the study area have increased steadily by 22.5 percent from 2000 to 2009, and by 31.1 percent from 2000 to 2016. During this same period, the Median HH Income of renter occupied households has only increased by 10.7 percent and 2.8 percent respectively, see Figure 8.5.
Incomes in the neighborhood are not keeping up with the increased cost of living. In 2016, renters spent about 23 percent of their household income on housing cost, compared to 20 percent in 2009, and 18 percent in 2000. When adjusted for inflation, the household median income of McKinley Park residents is comparable, if now lower, than it was 16 years ago. People who spend a high percentage of their income in housing have less to spend locally at restaurants, retail, and overall day-to-day needs.
While asking rents have increased, the neighborhood’s rents remain low compared to other neighborhoods in the city.
Table 8.1. Renter Occupied Median HH Income, Annual Rent Per Unit, and Percent of HH Income Spent on Housing, 2000, 2009, 2016
| 2000 | 2009 | 2016 | |
| Renter Occupied Median Household Income | $28,990 | $32,090 | $29,804 |
| Annual Rent Per Unit | $5,124 | $6,276 | $6,720 |
| % of HH Income spent on Housing | 17.68% | 19.56% | 22.55% |
Source: CMAP Analysis of the 2000 U.S. Decennial Census data and American Community Survey Five-year Estimates, 2005-09 and 2012-16
Figure 8.5. Percent Change of Renter Occupied Median HH Income and Annual Rent Per Unit, 2000, 2000-09, and 2012-16
Source: CMAP Analysis of the 2000 U.S. Decennial Census data and American Community Survey Five-year Estimates, 2005-09 and 2012-16
Housing Sales
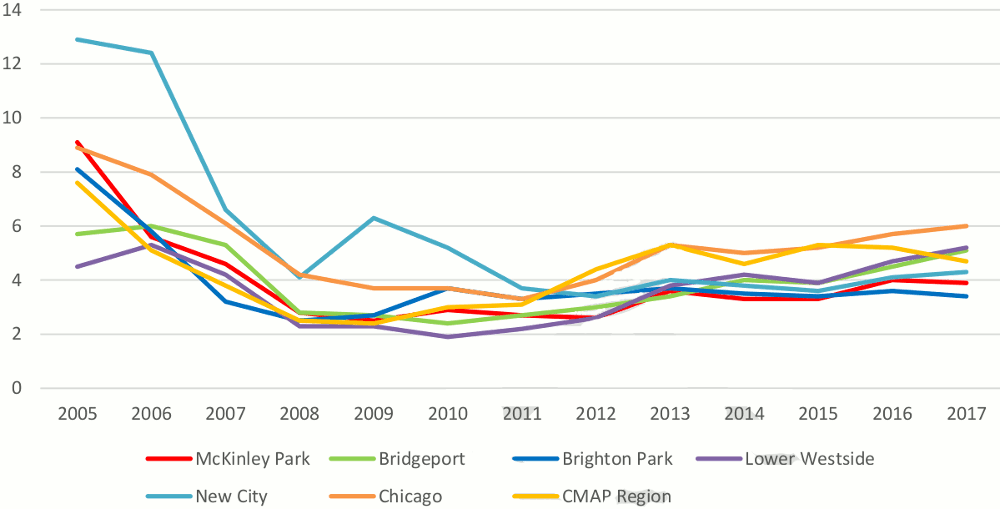
Housing sales activity in McKinley Park is very similar to that of other nearby communities, but the market is more sluggish than that for Chicago as a whole or the region (see Figure 8.5). The rate of home sales in McKinley Park remains below 2007 levels, but have increased slightly in recent years. Sales activity translates into changes in home prices. Based on the DePaul Institute for Housing Studies’ analysis of U.S. Census data, nearly half of owner-occupied homes (51 percent) in the neighborhood are valued at below $200,000, and an additional 44 percent are valued between $200,000 and $500,000. Under 4 percent of owner-occupied homes in the study area are valued more than $500,000.
Figure 8.5. DePaul University Institute for Housing Studies Residential Sales per 100 Parcels, 2005-17
Source: DePaul Institute for Housing Studies, 2005-17







Log In to comment on this item.
Subscribe
Report
My comments