


Understanding the composition of the community and demographic trends will help local organizations and community stakeholders respond to the needs of its existing residents as well as prepare for potential changes. The demographics of the larger Chicago region are expected to shift substantially over the next three decades; similar changes are anticipated in the McKinley Park community.
After experiencing significant population decline for most of the twentieth century, McKinley Park grew sharply in the 1980s and 90s, before stabilizing since that time.
On average, McKinley Park’s families are larger and its population is younger than elsewhere in the Region and Chicago. The average household size in McKinley Park was 3.1 individuals in 2016 which is approximately 21 percent larger than that of Chicago or the region (see Table 2.2). Similarly, 27.5 percent of the McKinley Park 2016 population was under 19 years of age compared to just 24.5 percent and 26.4 percent in Chicago and the Region respectively.
Table 2.2 Population and Households, 2000 - 2016
| McKinley Park | Chicago | CMAP Region | |
| Population, 2016 | 16,064 | 2,714,017 | 8,501,507 |
| Population, 2000 | 15,962 | 2,896,016 | 8,146,264 |
| % Population Change, 2000-16 | 0.6% | -6.3% | 4.4% |
| Average Household Size, 2016 | 3.1 | 2.5 | 2.7 |
| Median Income, 2016 | $43,496 | $50,434 | $65,174 |
Source: CMAP analysis of the 2000 U.S. Decennial Census data and American Community Survey five year estimates for 2012-2016.
Table 2.3 Age Cohorts and Median Age, 2016
| McKinley Park | Chicago | CMAP Region | ||
| Count | Percent | Percent | Percent | |
| Youth (under 19 years) | 4,424 | 27.5% | 24.5% | 26.4% |
| Adults (20 to 64 years) | 10,016 | 62.3% | 64.2% | 60.9% |
| Older Adults (65 years and over) | 1,624 | 10% | 11.2% | 12.6% |
| Median Age* | 33.4 | 33.9 | 36.7 | |
Source: CMAP analysis of American Community Survey five year estimates for 2012-2016.
*Note that all CCA & regional medians were estimated using grouped frequency distributions.
Race and Ethnicity
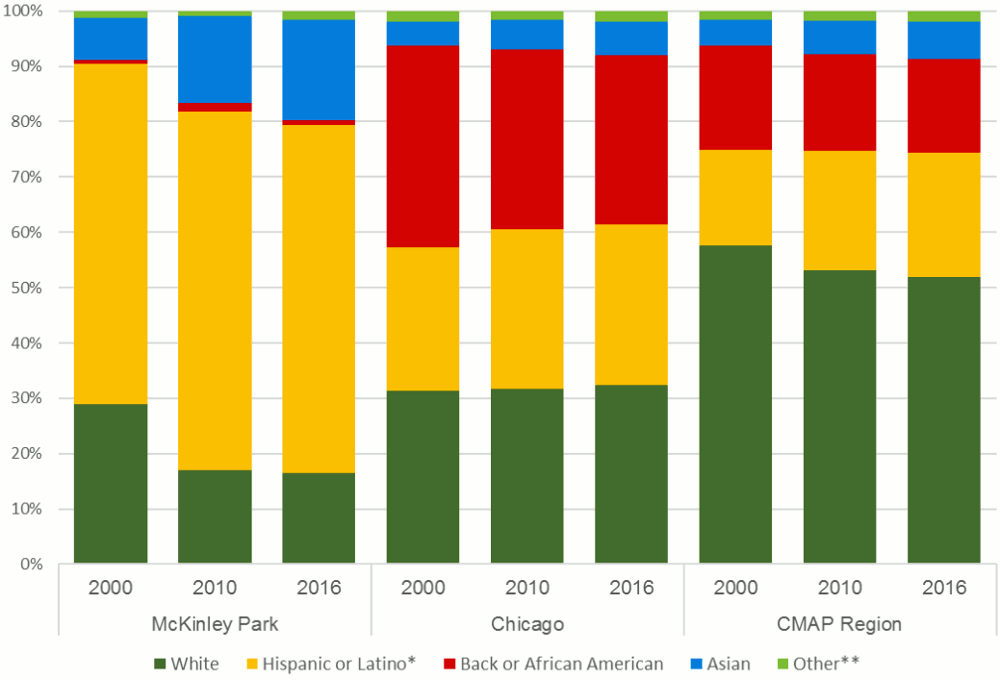
Self-reported data on race and ethnicity indicates that the study area features relatively large populations of Latino and Asian residents. In 2016, the study area’s racial and ethnic composition included a mix of 62.8 percent Latino, 18.2 percent Asian, 16.6 percent White, and 0.9 percent African American. This racial composition differs from that of the city, as well as that of the region.
Between 2000 and 2016, the White population of the study area decreased from 4,607 to 2,660 (or 42.3 percent). During this same period, the Black or African American population decreased by 25 percent. Meanwhile, the Latino/Hispanic population increased slightly by 2.8 percent while the Asian population increased significantly by 140.8 percent.
Figure 2.4 Race and Ethnicity in McKinley Park, Chicago, and CMAP Region, 2000 - 2016
Source: CMAP analysis of U.S. Decennial Census data 2000, 2010, and American Community Survey five year estimates for 2012-2016.
Table 2.4 Race and Ethnicity by Select Community Areas, 2016
| McKinley Park | Bridgeport | New City | Brighton Park | South Lawndale | Lower West Side | |
| White | 16.6% | 33.4% | 12.1% | 6.3% | 3.4% | 15.0% |
| Hispanic or Latino* | 62.8% | 24.9% | 61.5% | 84.7% | 84.0% | 77.9% |
| Back or African American | 0.9% | 2.6% | 23.1% | 1.0% | 11.9% | 3.8% |
| Asian | 18.2% | 37.2% | 2.4% | 7.4% | 0.3% | 2.2% |
| Other** | 1.5% | 1.9% | 1.0% | 0.6% | 0.4% | 1.1% |
Source: CMAP analysis of American Community Survey five year estimates for 2012-2016.
* Includes Hispanic or Latino residents of any race.
** Includes American Indian and Alaska Native, Native Hawaiian and Other Pacific Islander, some other race, and two or more races.
Ancestry and Language
The neighborhood’s vast racial and ethnic diversity is evident in the wide range of languages spoken in McKinley Park and the many different countries of origin among foreign-born residents. Spanish is the most common non-English language, reflecting the large numbers of immigrants from Latin America. Many Asian and European languages are also spoken in the area, including Chinese, Polish, and Korean. The extent and importance of the neighborhood’s cultural and linguistic diversity is discussed in greater depth in Section 4.






Log In to comment on this item.
Subscribe
Report
My comments