


In order to prosper economically and sustain a high quality of life, McKinley Park and the Chicago region need to maintain a diversity of business types, a skilled workforce, and modern infrastructure. Industrial, retail, and office development in McKinley Park are influenced by trends within the community, but also the larger sub-regional and regional markets for each sector. This section provides an overview of this larger economic development context to ensure McKinley Park stakeholders move forward with a plan that reflects market realities.
Employment
According to 2015 data from the Longitudinal Employer-Household Dynamics (LEHD) – a program of the Center for Economic Studies at the U.S. Census Bureau – nearly 5,109 people work in the study area, which was a 15.3 percent decrease from 2005. The largest employment sectors in the study area were administration and support with 1,486 jobs, and wholesale trade with 829 jobs. Historically an industrial hub, manufacturing, transportation and warehousing businesses provide 18.6 percent of jobs.
The fastest growing job sector in the community was educational services (which grew by 1200 percent), followed by professional services (+204.8 percent), and wholesale trade (+68.2 percent). However, some sectors saw significant declines between 2005 and 2015; manufacturing employment, for example, declined from 2,352 to 566 jobs.
According to the 2016 American Community Survey five-year estimates, residents of McKinley Park had an unemployment rate of 12.5 percent, which is higher than the rates experienced citywide (10.9 percent) and region wide (8.4 percent).
Table 2.6 Employment (Primary Jobs) in McKinley Park, 2005-2015
| McKinley Park | Chicago | CMAP Region | |
| Employment, 2005 | 6,029 | 1,068,416 | 3,476,153 |
| Employment, 2015 | 5,109 | 1,234,954 | 3,788,375 |
| Change, 2005-15 | -920 | 166,538 | 312,222 |
| Change as %, 2005-15 | -15.3% | 15.6% | 9.0% |
Source: CMAP analysis of Longitudinal Employer-Household Dynamics, U.S. Census
Table 2.7 Total Employment in the Community and of Residents, 2015
| EMPLOYMENT IN THE COMMUNITY | ||
| By Top Ten Industry Sector | Count | Percent |
| Administration and Support | 1,486 | 29.1% |
| Wholesale Trade | 829 | 16.2% |
| Retail Trade | 738 | 14.4% |
| Manufacturing | 566 | 11.1% |
| Transportation and Warehousing | 383 | 7.5% |
| Accommodation and Food Services | 340 | 6.7% |
| Finance and Insurance | 171 | 3.3% |
| Professional Services | 128 | 2.5% |
| Other Services | 109 | 2.1% |
| EMPLOYMENT OF RESIDENTS | ||
| By Top Ten Industry Sector | Count | Percent |
| Accommodation and Food Services | 730 | 12.9% |
| Health Care and Social Assistance | 615 | 10.8% |
| Manufacturing | 613 | 10.8% |
| Administration and Support | 566 | 10.0% |
| Retail Trade | 529 | 9.3% |
| Educational Services | 448 | 7.9% |
| Professional Services | 399 | 7.0% |
| Wholesale Trade | 306 | 5.4% |
| Finance and Insurance | 279 | 4.9% |
| Transportation and Warehousing | 245 | 4.3% |
Source: Longitudinal Employer-Household Dynamics, U.S. Census, 2015.
Commercial and Industrial Property
Industrial buildings are primarily located along Pershing Road, Ashland Avenue (to the river), and on 33rd Street to the I-55. Office buildings are concentrated at the intersection of 35th Street and Archer Avenue. Retail buildings are located along a “commercial triangle” composed of Archer Avenue, 35th Street, and Ashland Avenue. Please see Section 8 for a detailed analysis of commercial and industrial properties in the study area.
Recent Developments
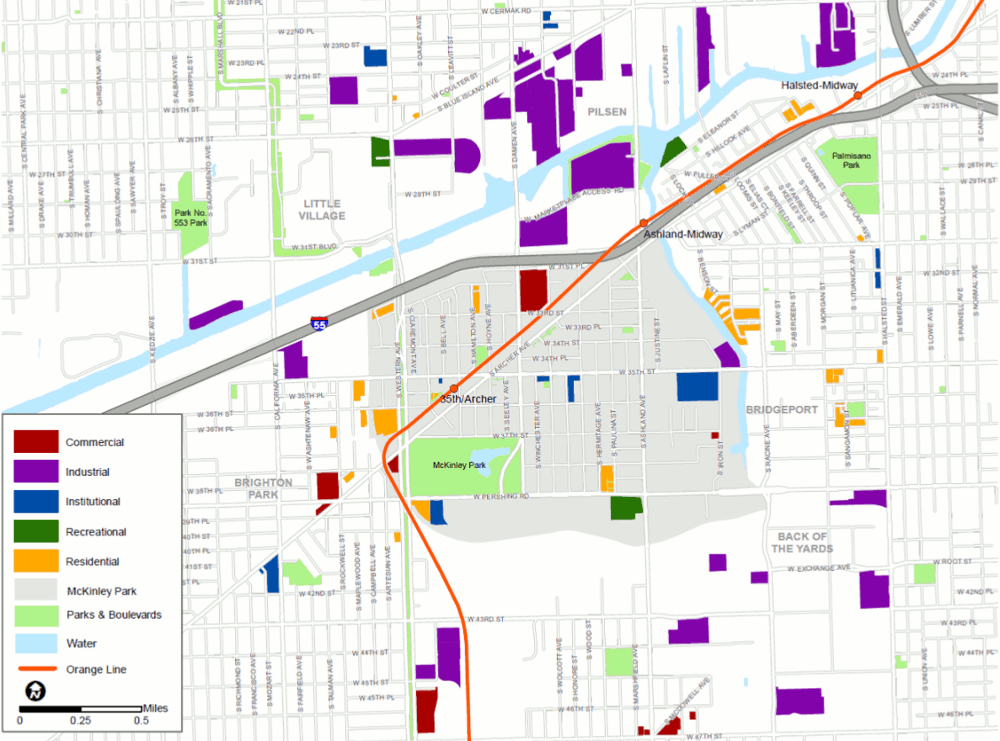
Since 2000, McKinley Park has seen several developments that have ranged in location and use, mostly residential, institutional, and manufacturing. Many of the new industrial projects are located along the Chicago River and rail lines. Completed in 2015, ComEd’s Chicago Training Center is the largest McKinley Park development in the last 17 years. New residential developments include the addition of 3211 S. Hamilton, Oakley Terrace, McKinley Park Lofts, and McKinley Gardens. The only major commercial development has been the Target at 31st Street and Damen Avenue, completed over a decade ago.
Figure 2.7 McKinley Park Recent Developments
Source: Chicago Metropolitan Agency for Planning, 2018.
Municipal Revenue and Real Estate
Ideally, local development decisions should make effective use of land, generate good jobs, and trigger sustainable economic development. To achieve this, local revenue streams must sustain public services and infrastructure investments that attract and retain both residents and businesses. When making decisions regarding the types and balance of revenue that will be used to fund public services, communities must also consider other issues such as quality of life, community, and economic development needs.
While Equalized Assessed Value (EAV) data reflect the residential character of McKinley Park, they also highlight the community as an employment destination anchored by the industrial corridor that runs along the eastern and southern edges of the community.
McKinley Park’s revenue stream is primarily derived from its residential properties which account for nearly 60 percent of the estimated EAV. Commercial and Industrial properties almost make up the rest of the EAV with 18 and 19 percent, respectively (Table 2.9). Unlike the City of Chicago, McKinley Park’s industrial properties make-up a substantial part of its EAV mix.
Table 2.8 Estimated Equalized Assessed Value (EAV) by Property Type, 2015
| McKinley Park* | Chicago | ||
| Property Type | Estimated EAV | Percent | Percent |
| Residential EAV | 68,913,780 | 57.9% | 61.8% |
| Commercial EAV | 21,576,576 | 18.1% | 35.2% |
| Industrial EAV | 22,771,043 | 19.1% | 2.7% |
| Transportation EAV | 1,850,189 | 1.5% | 0.2% |
| Mixed Use EAV | 3,861,717 | 3.2% | -- |
| Total EAV | 118,973,305 | 99.8% | 99.9% |
Source: Cook County Assessor
*Includes property tax exemptions










Log In to comment on this item.
Subscribe
Report
My comments